
Wednesday, November 23, 2016
Creative Class
Source: https://www.washingtonpost.com/news/wonk/wp/2014/09/29/mapped-how-the-creative-class-is-dividing-u-s-cities/
Their analysis separates workers into three classes, derived from Florida's research: the "creative class" of knowledge workers who make up about a third of the U.S. workforce (people in advertising, business, education, the arts, etc.); the "service class," which makes up the largest and fastest growing sector of the economy (people in retail, food service, clerical jobs); and the "working class," where blue-collar jobs in industries like manufacturing have been disappearing (this also includes construction and transportation).
The American Community Survey captures the types of occupations held by residents in local neighborhoods. Florida and his co-authors condensed those results into the three categories above — this is an admittedly imperfect exercise — and mapped the results by census tract across the 12 metros. The map above shows metropolitan Washington, where divisions between the service and creative classes are particularly striking, and where working-class neighborhoods appear all but extinct. In the purple splotches, "creative class" workers make up a plurality of working residents over 16.
Florida's picture doesn't necessarily mean that the wealthiest people in the metropolitan region now live there, but that the area is increasingly home to skilled workers like freelance graphic designers, non-profit managers, or Hill staffers. A non-profit manager and a lawyer might not earn the same income, but they use a similar set of intellectual skills that rely on creative, critical thinking. And they want to live near each other.

As this creative class expands into cities, repeatedly it's clustering downtown, along transit lines, near big institutions like universities, and close to natural amenities like waterfronts. And as these workers drive up the cost of living in these places, service and working-class residents are effectively left with the least desirable parts of town, the longest commutes and the fewest amenities. This is the darker side of Florida's ascendent "creative class."
Their analysis separates workers into three classes, derived from Florida's research: the "creative class" of knowledge workers who make up about a third of the U.S. workforce (people in advertising, business, education, the arts, etc.); the "service class," which makes up the largest and fastest growing sector of the economy (people in retail, food service, clerical jobs); and the "working class," where blue-collar jobs in industries like manufacturing have been disappearing (this also includes construction and transportation).
The American Community Survey captures the types of occupations held by residents in local neighborhoods. Florida and his co-authors condensed those results into the three categories above — this is an admittedly imperfect exercise — and mapped the results by census tract across the 12 metros. The map above shows metropolitan Washington, where divisions between the service and creative classes are particularly striking, and where working-class neighborhoods appear all but extinct. In the purple splotches, "creative class" workers make up a plurality of working residents over 16.
Florida's picture doesn't necessarily mean that the wealthiest people in the metropolitan region now live there, but that the area is increasingly home to skilled workers like freelance graphic designers, non-profit managers, or Hill staffers. A non-profit manager and a lawyer might not earn the same income, but they use a similar set of intellectual skills that rely on creative, critical thinking. And they want to live near each other.
As this creative class expands into cities, repeatedly it's clustering downtown, along transit lines, near big institutions like universities, and close to natural amenities like waterfronts. And as these workers drive up the cost of living in these places, service and working-class residents are effectively left with the least desirable parts of town, the longest commutes and the fewest amenities. This is the darker side of Florida's ascendent "creative class."
Capitalism 2
https://docs.google.com/spreadsheets/d/1zpR62eEjsX8-ExhtY2O5CeVIYY7Mrb50F8RUgKM9BjM/edit#gid=0
Cheat Codes: "While playing a game, hold [Shift] and press 6789 to enable cheat mode. If you entered the code correctly, a message will appear. Enter one of the following codes to activate the corresponding cheat function" 10,000,000 extra credits = [Alt] + C
Cheat Codes: "While playing a game, hold [Shift] and press 6789 to enable cheat mode. If you entered the code correctly, a message will appear. Enter one of the following codes to activate the corresponding cheat function" 10,000,000 extra credits = [Alt] + C
Best and Worst Places to Raise Children (Heatmap of Income Mobility)
http://www.nytimes.com/interactive/2015/05/03/upshot/the-best-and-worst-places-to-grow-up-how-your-area-compares.html?WT.mc_id=2015-KWP-AUD_DEV&WT.mc_ev=click&ad-keywords=AUDDEVREMARK&kwp_0=18175&kwp_4=132240&kwp_1=156631&_r=0
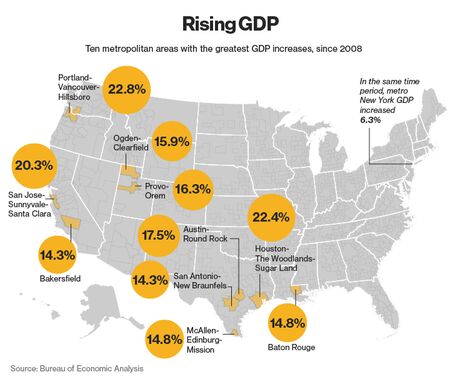
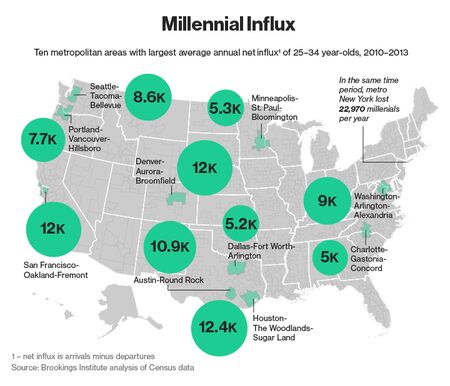
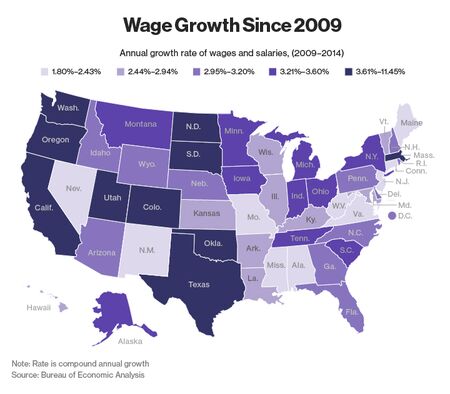
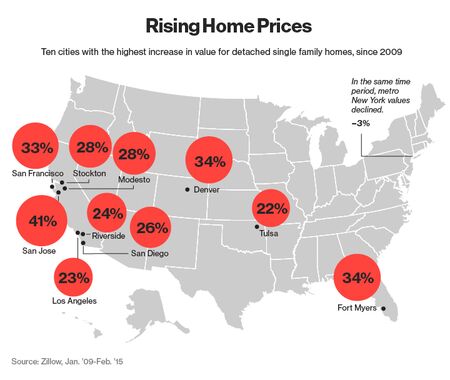
Where are the millenials headed?
http://www.bloomberg.com/news/articles/2015-04-27/when-your-kid-moves-out-west-she-takes-the-u-s-economy-with-her
When Your Kid Moves Out West, She Takes the U.S. Economy With Her
When Your Kid Moves Out West, She Takes the U.S. Economy With Her
Tuesday, November 15, 2016
High vs. Low Skill (Manufacturing/ Service)
Stephen Weymouth (Georgetown University) “Winners and Losers in International Trade: The Effects on U.S. Presidential Voting” (joint work with Brad Jensen and Dennis Quinn)
Summary: The US economy needs low-skill workers now more than ever, and that requires a legal channel for the large-scale, employment-based entry of low-skill workers. The alternative is what the country has now: a giant black market in unauthorized labor that hinders job creation and harms border security. A legal time-bound labor-access program could benefit the American middle class and low-skill workers, improve US border security, and create opportunities for foreign workers.


Interesting point made that US running a deficit when it comes to manufacturing, not service sector.
He further separated the high-skilled vs. low-skilled occupations (by income).
Turning into job projections...
http://www.cgdev.org/sites/default/files/archive/doc/full_text/CGDBriefs/3120183/time-bound-labor-access.html
Summary: The US economy needs low-skill workers now more than ever, and that requires a legal channel for the large-scale, employment-based entry of low-skill workers. The alternative is what the country has now: a giant black market in unauthorized labor that hinders job creation and harms border security. A legal time-bound labor-access program could benefit the American middle class and low-skill workers, improve US border security, and create opportunities for foreign workers.
Monday, November 14, 2016
Social Progress Index
http://www.ted.com/talks/michael_green_what_the_social_progress_index_can_reveal_about_your_country
The story
https://www.project-syndicate.org/commentary/economic-development-social-progress-index-by-michael-porter-2015-04
The data reveal that many aspects of social progress, not surprisingly, tend to improve with income growth. Wealthier countries, such as Norway (which holds the top spot on this year’s SPI), generally deliver better social outcomes than lower-income countries.
But a striking finding is that GDP is far from being the sole determinant of social progress. Costa Rica, for example, has achieved a higher level of social progress than Italy, with barely a third of Italy’s per capita GDP.
And Costa Rica is not an isolated case. Across the spectrum of countries, from rich to poor, we see examples, such as New Zealand and Senegal, that are far more successful at translating their economic growth into social progress than others, such as the United States and Nigeria. Many of the fast-growing emerging economies, including China and India, have also not yet been able to attain the level of social progress that their economic progress enables.
Where there is an imbalance between economic growth and social progress, political instability and unrest often arise, as in Russia and Egypt. Lagging social progress also holds back economic growth in these and other countries that fail to address human needs, build social capital, and create opportunity for their citizens. Countries must invest in social progress, not just economic institutions, to create the proper foundation for economic growth.
In my own experience, I have seen how Rwanda made investing in social progress – including gender equity, a 61% reduction in child mortality in a single decade, and 95% primary school enrollment – integral to its economic development strategy. Rwanda’s positive economic performance would not have been possible without improvement in these and other dimensions of social progress.
Focusing on social progress in this way leads to better development strategies, and builds political support for the controversial steps sometimes needed to increase prosperity. Rigorous measurement of social performance, alongside traditional economic indicators, is crucial to starting the virtuous circle by which GDP growth improves social and environmental performance in ways that drive even greater economic success. And, by avoiding narrow debates, such as GDP versus income inequality, the SPI provides an essential tool with which to craft a feasible agenda that does just that.
Thursday, November 3, 2016
Comparison of Databases
https://www.sas.upenn.edu/~vr0j/econ8185/datadoc1.pdf
http://libguides.princeton.edu/IncomeSurveys
http://libguides.princeton.edu/IncomeSurveys
Census 2000 Short Form vs Long Form
https://www.census.gov/dmd/www/pdf/d3239a.pdf
https://ask.census.gov/faq.php?id=5000&faqId=145
The four summary files below for Census 2000 are among the most detailed data products available from the population and housing census.
All four files show data for states, the District of Columbia, Puerto Rico, counties, county subdivisions, cities, American Indian and Alaska Native areas, Hawaiian Home Lands, and census tracts. SF 1 has the most geographic detail, with data for census block groups and blocks; SF 3 has data for block groups. Both SF 1 and SF 3 have data for ZIP Code Tabulation Areas®, Congressional districts, and metropolitan areas.
SF 1 and SF 3 have data on a larger set of topics than do SF 2 and SF 4. What makes SF 2 and SF 4 special is the vast data on population subgroups found on these files.
SF 2 repeats tables for up to 249 race (e.g., Black, Chinese, Asian Indian, etc.) and Hispanic/Latino groups (e.g., Mexican, Cuban, Salvadoran, etc.), as well as American Indian and Alaska Native tribes. SF 4 repeats tables for these groups and also for up to 86 ancestry groups.
https://ask.census.gov/faq.php?id=5000&faqId=145
The four summary files below for Census 2000 are among the most detailed data products available from the population and housing census.
- Summary File 1 (SF 1) and Summary File 2 (SF 2) focus on the information collected on the census short form – namely on age, sex, race, Hispanic/Latino origin, households, families, housing units, and owner/renter status.
- Summary File 3 (SF 3) and Summary File 4 (SF 4) focus on social, economic and housing characteristics compiled from a sample of approximately 19 million housing units (about 1 in 6 households) that received the Census 2000 long-form questionnaire.Topics include income, education, occupation, ancestry, disability, foreign birth, commuting, household financial arrangements, year housing structure built and many other population and housing subjects.
All four files show data for states, the District of Columbia, Puerto Rico, counties, county subdivisions, cities, American Indian and Alaska Native areas, Hawaiian Home Lands, and census tracts. SF 1 has the most geographic detail, with data for census block groups and blocks; SF 3 has data for block groups. Both SF 1 and SF 3 have data for ZIP Code Tabulation Areas®, Congressional districts, and metropolitan areas.
SF 1 and SF 3 have data on a larger set of topics than do SF 2 and SF 4. What makes SF 2 and SF 4 special is the vast data on population subgroups found on these files.
SF 2 repeats tables for up to 249 race (e.g., Black, Chinese, Asian Indian, etc.) and Hispanic/Latino groups (e.g., Mexican, Cuban, Salvadoran, etc.), as well as American Indian and Alaska Native tribes. SF 4 repeats tables for these groups and also for up to 86 ancestry groups.
CPS vs. NLSY
Some previous research suggests that discrepancies exist between the National Longitudinal Survey of Youth and the Current Population Survey in terms of earnings trends; when the sample is limited to full-time, year-round workers, however, the discrepancies are largely eliminated.
Source: http://www.bls.gov/opub/mlr/2000/03/art4full.pdf
Source: http://www.bls.gov/opub/mlr/2000/03/art4full.pdf
Wednesday, November 2, 2016
Subscribe to:
Comments (Atom)